

Summary
Warehouse profiling is the process of analyzing inventory data to understand order patterns, SKU velocity, layout efficiency, process performance, and technology readiness. It can dentify where the operation is losing time, labor, and money, and what to fix first.
What is warehouse profiling?
Warehouse profiling goes by a few names: warehouse activity profiling, warehouse assessment. The terms are used interchangeably in the industry. The classic breakdown from Argon & Co splits it into two elements: the order profile (what your orders look like) and the item profile (how products move, how they are sized, how much space they take up). Modern profiling adds three more pillars. A complete warehouse assessment covers five in total:
- Order profiling: analyzing the structure and patterns of incoming orders
- Item and SKU profiling: assessing the movement, size, and behavior of individual products
- Layout and walk distance analysis: measuring how efficiently the physical space supports the flow of work
- Process flow and productivity mapping: identifying where time is lost between receiving and dispatch
- Technology readiness: checking whether your data and systems can support the optimization you are planning
The tracking gap. Most warehouses don't have this picture in one place. What they have is a WMS, some KPI dashboards, and an Excel file someone built off last month's export. It gets stale fast: the format changes, the file grows too slow to open, or the person who maintained it leaves. The result is an operational view that is perpetually weeks out of date.
The consulting alternative. Hiring a firm takes 6-8 weeks and delivers a report. By the time it arrives, the order patterns it analyzed have shifted. There is also a structural incentive for these engagements to grow. The analysis is solid. The cost and timeline are the problem.
What has changed. Warehouse optimization software now runs this analysis automatically, using metaheuristic algorithms that process months of order history, map SKU movement, simulate walk distances, and surface specific actions across slotting, picking, and packing. Not as a one-time deliverable. As a live operational baseline that updates as your patterns change.
One distinction worth making: a warehouse audit checks compliance (safety protocols, 5S, quality standards). Profiling measures operational performance. Both are useful, but they answer different questions. With labor at 70% of warehouse costs (Paycor, 2024), finding out where it is going is not optional.
Understanding how your customers buy
Order profiling is the analysis of what your orders actually look like. How many lines per order. How many units per line. Whether orders are single-SKU or mixed. How they shift through the day, the week, and the year. It is the input that determines which picking strategy makes sense for your operation and which one is costing you walking time right now.
The basic outputs of order profiling are:
- Order line distribution: what share of orders carry 1 line, 2-5 lines, 5-10, 10+? A warehouse where 70% of orders are single-line operates very differently from one where 70% are 10+ lines.
- Order unit distribution: are orders typically one unit per line, or do customers order in bulk? This affects how you size totes, trolleys, and staging areas.
- Order mix by type: B2C vs B2B orders have different picking profiles. B2C tends toward high-frequency, low-volume, time-sensitive, with orders shipping in individual boxes across a wide mix of SKU combinations. B2B tends toward lower frequency, higher volume, often with tighter pick sequence requirements and mixed-SKU pallets built to carrier or store specifications. The mix determines not just how you pick, but how you pack.
- Temporal patterns: when orders peak during the day, week, and year. A spike in single-line orders at 9 AM every Monday means something specific about staffing and slotting that a daily average would hide.
Picking strategy follows order profile. A warehouse where 70% of orders carry a single line should not be running the same picking method as one where 70% carry 10+ lines. Running the wrong method adds 20-30% unnecessary walking per order, with no benefit to throughput.
The order profile also determines how much you can gain from order clustering and pick sequencing. Clustering groups picks from nearby locations into a single trolley run; sequencing minimizes travel distance. For warehouses where most orders carry five or fewer lines, clustering alone can cut walk time by 30% or more. The profile tells you which method will provide savings and which not.
For a full breakdown of picking methods and which order profile each suits, see our guide on which picking strategy fits your order profile.
Who are your fast movers?
SKU profiling is the analysis of how individual items move through the warehouse. It answers one question: which products do you pick most often, and where are they located right now?
Most warehouses know their fastest movers in general terms. What they rarely have is the actual numbers: pick frequency per SKU by day and zone, which items are co-picked most often, where exactly they are located relative to packing. "Product X sells a lot" is not the same as knowing it is picked 140 times a day from 180 meters out. SKU profiling gives you the second version. From that, four core outputs:
- Velocity profile (pick frequency): how often each SKU is picked per day, week, or month. The standard output here is an ABC classification: A-movers are picked daily, B-movers weekly, C-movers occasionally.
- Volume profile (cube movement): how much physical space each SKU occupies in outbound orders. A slow-moving SKU that ships in large quantities still has high cube movement and may need to be treated differently from a fast mover of the same physical size.
- Item order completion profile: which SKUs consistently appear in the same orders? High co-pick rates mean those items should be slotted near each other, regardless of individual velocity.
- Physical characteristics: dimensions, weight, fragility. These affect how items can be stored and what picking methods work for them.
The outputs feed directly into slotting decisions. Fast movers belong close to packing. Items that ship together belong in the same zone. Bulky C-movers go to the back. Without the data, these decisions get made by simple Excel logic or gut-feel.
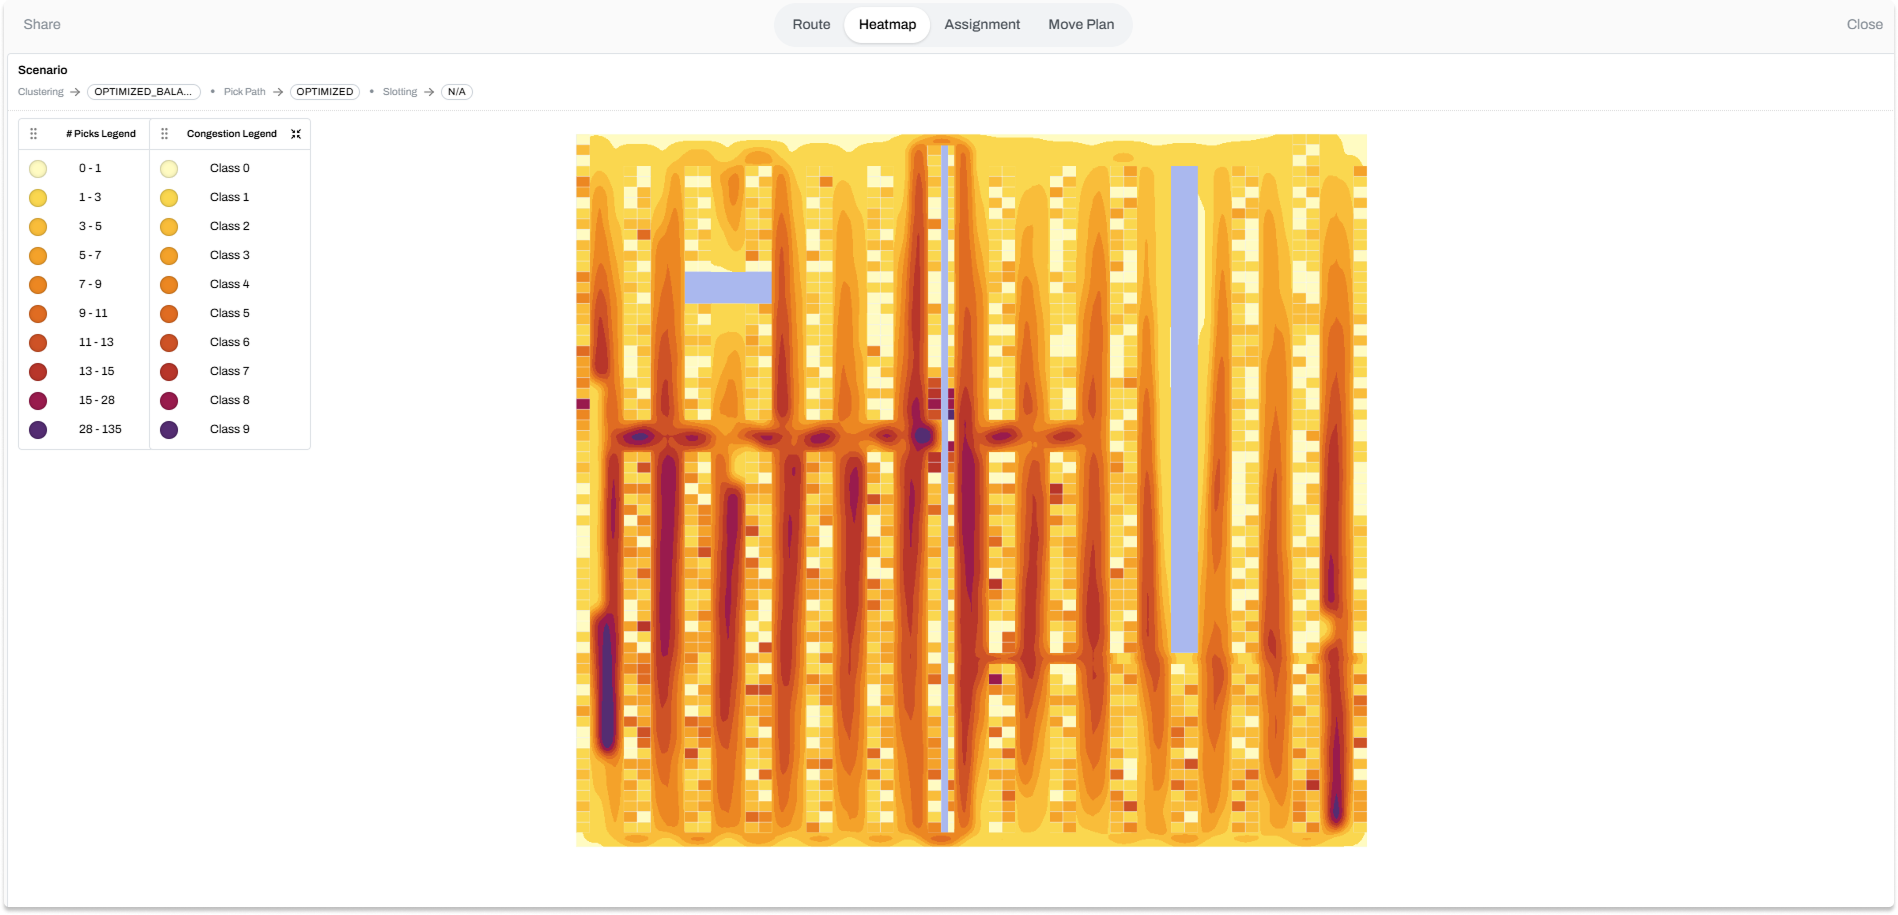
3PL Companies like Bleckmann use Pulse's warehouse profiling tool to reorganize their warehouse layouts and save money with order picking optimization. The heatmap makes the argument visible. You can show the team exactly where walk distance is going and which slot assignments are causing it, rather than asserting there is a problem and hoping people believe you. For a deeper look, see our guide on ABC analysis and heatmap-based slotting.
One practical point: most teams cannot move 2,000 SKUs in a weekend. A complete slot overhaul creates its own disruption, and it is not necessary to see results. The more useful output is a ranked move plan: the 15-20% of slot changes that will generate the majority of walk distance reduction, sorted by priority. You execute those changes in batches, measure the impact on pick rates, and move to the next round. The floor keeps running. The gains accumulate.
Where does the time go?
Pick rate is the number most warehouse managers track. Walk time is the number that determines it. Layout and walk distance analysis makes the invisible visible: it shows you exactly how far your pickers travel to fulfill a typical order, which zones they visit most, and whether your current product placement is working for or against your order patterns.
The central tool here is the heatmap. A pick frequency heatmap overlays your warehouse floor plan with color-coded intensity based on how often each location is visited. Hot zones (high pick frequency) that are far from the packing area show up immediately. Underused fast-pick zones show up too. The heatmap does not tell you what to do, but it makes the inefficiency impossible to argue with.
Beyond heatmaps, layout analysis covers:
- Walk distance simulation: calculating the average and total distance traveled per order, per picker, per shift, based on current slot assignments and order patterns
- Zone configuration review: assessing whether the zone boundaries, aisle widths, and staging locations match the actual flow of work
- Congestion point identification: where pickers collide or wait, particularly around staging areas and packing stations during peak hours
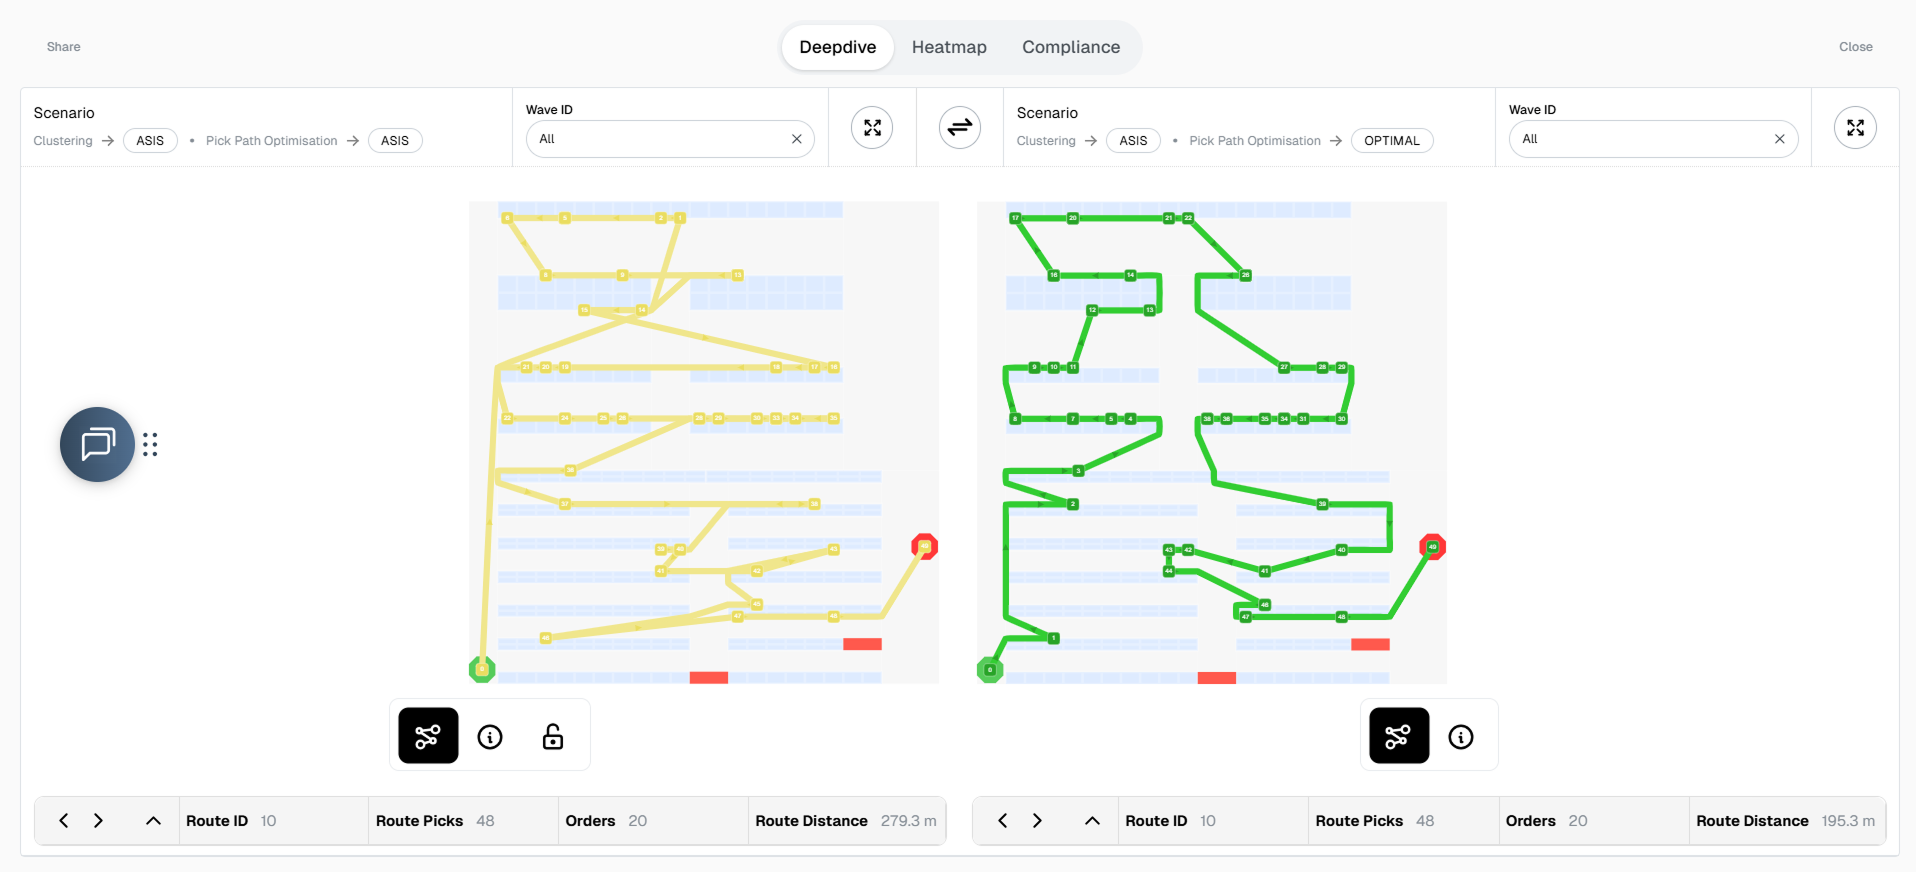
Across our customer base, profiling-driven slotting cuts picker walking distance by 20-40%. Fewer steps per order means more orders per hour, fewer pickers per shift, lower cost per order shipped. Walk distance is the number that determines how many FTEs you need on the floor.
Before you can analyze layout efficiency, you need an accurate digital representation of your warehouse floor plan. If you have not done that yet, our guide to warehouse layout mapping explains how to capture and digitize your space in a way that makes analysis and simulation possible.
Diagnosing your operation
Process flow and productivity mapping
Order and SKU data tell you what moves through the warehouse. Process mapping tells you how it moves, where it slows down, and what the numbers look like across shifts and teams.
The key outputs of process flow analysis:
- Pick rates by team and shift: lines per hour is the standard unit. Significant variation between shifts doing the same work points to a training or process inconsistency issue, not a technology one.
- Labor utilization: what share of shift time is active picking vs. waiting, searching, or handling exceptions? Low utilization on a well-staffed shift often means congestion or poor task assignment, not slow workers.
- Bottleneck mapping: where do orders queue? Common bottlenecks are packing stations at shift end, inbound staging when receiving overlaps with outbound peaks, and replenishment delays that create empty pick faces mid-shift.
- Throughput vs. capacity: can your current layout and process handle peak volume? The Swisslog State of Warehouse 2025 report found that 93% of warehouses rank throughput as their primary ROI driver. Ask most managers what is specifically limiting their throughput right now, and they will have an answer. Ask them to back it up with data, and the conversation gets harder.
With warehouse worker turnover at around 36% (Omniful, 2025), a lot of operational knowledge walks out the door with people: the WMS workaround, the aisle shortcut, why the night shift packs differently. Process mapping captures it before it disappears.
Technology readiness
Technology readiness is the profiling pillar that most people underestimate until a project is already in trouble. It answers the question: does your data and systems infrastructure actually support the optimization you are planning?
The Swisslog 2025 report found that 97% of warehouses have rolled out some form of automation, but 48% are less than 50% automated. Automation built on incomplete master data produces wrong outputs. The system is only as good as what you feed it.
A technology readiness check covers:
- WMS data quality: are item dimensions, weights, and storage locations in the system accurate and complete? Missing or incorrect master data makes order profiling and slotting analysis unreliable.
- Historical data availability: how many months of order history can you export? Six months is a minimum for seasonal pattern detection; 12-24 months is better.
- Integration readiness: can your WMS accept optimization outputs via API, or would changes have to be uploaded manually? This affects how quickly you can act on profiling findings.
- Data gaps: which SKUs have no dimensions on record? Which locations lack coordinates in the system? These gaps need to be filled before optimization can run accurately.
Pulse handles the technology readiness check as part of its onboarding data validation step. Before any optimization runs, the system flags duplicate location codes, and hierarchy errors in the order data. This is the step that surfaces the data problems that would otherwise quietly undermine whatever comes next.
What the data tells you to do
Each pillar produces a specific finding. Each finding maps to a specific decision. Here is what that looks like in practice.
The common failure mode is treating these pillars as separate projects. A warehouse that fixes its slotting without updating its picking batching rules will see partial gains. The value of profiling comes from seeing all five pillars together, so optimization decisions in one area do not create new problems in another.
This is what Pulse does differently. The onboarding data import is the profiling step. You import order history, SKU master, and layout from your WMS and within seconds Pulse generates warehousea heatmaps, walk distance simulations, and what-if scenarios based on your actual operation.
Questions?
A warehouse profile requires three data sources: order history (typically 6-24 months of outbound orders with order lines and quantities), an item master (SKU dimensions, weights, storage locations), and a warehouse layout file (location codes, coordinates, zone assignments).
A traditional consulting-led warehouse assessment takes 2-3 months from data collection to final report. With software-driven profiling, the timeline is much shorter. Once the data is available, initial profiling outputs (heatmaps, order distributions, walk distance analysis) are available within seconds. The time investment shifts from data gathering and manual analysis to interpreting the outputs and deciding what to act on first.
A warehouse audit checks compliance with standards: safety protocols, 5S methodology, process adherence. Warehouse profiling analyzes operational performance through data. An audit asks "are we following the rules?" Profiling asks "are we operating efficiently, and where is the evidence?" Both have value, but profiling is the input for optimization decisions, while an audit is the input for compliance corrections. The two can run in parallel, but they answer different questions.