

Warehouse slotting is the practice of assigning each product to a specific storage location based on how often it gets picked, what else it ships with, and the physical constraints of your operation. When slotting is done right, pickers walk shorter distances, orders ship faster, and your warehouse uses its space efficiently. When slotting is done poorly, or not at all, you leave 15-30% of your picking capacity on the table.
Pickers in most warehouses spend 60-70% of their shift walking, not picking (AutoStore, 2025).
The single biggest lever you have over that walk time is where products sit on the shelf. Storage location assignment is, according to research published in Applied Sciences (Manzini et al., 2021), a primary factor in total pick time reduction, with models combining ABC velocity classification and physical constraints showing significant travel distance minimization.
This guide breaks down warehouse slotting from first principles: what it is, the five rules that make a slotting strategy work, the difference between static and dynamic slotting, and how to run your first slotting optimization pilot without shutting down operations. Whether you slot 500 SKUs in a spreadsheet or 50,000 with software, every concept here applies.
What Is Warehouse Slotting (and Why Does It Get Ignored)?
Most warehouses slot by historical accident.
Products are stored where they arrived when the warehouse opened or where they fit after the last reshuffle. What made sense in month one rarely makes sense in month twelve.
Demand patterns shift.
Seasonal items become year-round bestsellers.
Suppliers change pack sizes.
The original slotting becomes progressively more suboptimal until picking walks are chaotic and space is wasted.
Slotting optimization improves pick efficiency by 25-35% in most operations. Across published benchmarks, warehouses that run a proper slotting project see walk distance drop, throughput climb, and capacity utilization jump by 20 percentage points or more. Yet a surprising number of warehouses skip slotting entirely, or do it once and never revisit it.
Why? Three reasons come up repeatedly:
Picking route optimization can reduce walking distance by 20-50%, but that assumes your fast movers are physically close to the packing station. If your fastest-moving SKUs are scattered across 15 different zones, even the best routing algorithm is working against a broken foundation.
Slotting is that foundation. Everything else in warehouse optimization, from batch picking to route sequencing to packing logic, performs better when products are in the right locations to begin with.
For a deeper look at why reducing warehouse travel compounds across every operation, see our breakdown of the levers that drive picking efficiency.
Five Principles of an Effective Slotting Strategy
Every slotting strategy, whether you run it in a spreadsheet or with dedicated software, rests on the same five principles. The specifics change based on your operation, but the logic does not. For a deeper look at how these strategies compare side by side, see the comparison of slotting strategies on our blog.
1. Velocity Is King (ABC Analysis)
ABC slotting sorts SKUs by pick frequency (Red Stag Fulfillment, 2025).
A items (your fastest movers, typically the top 20% of SKUs) go to the best locations: close to the packing station, at ergonomic pick height, in high-traffic aisles. B items (next 30%) fill secondary locations. C items (the long tail, bottom 50%) go to remote zones.
What counts as a "best location" depends on your layout and your picking strategy. In a zone-based warehouse, that means the central pick zone at waist-to-eye height. In a long-aisle warehouse, it means the aisles closest to the loading dock. The 20/30/50 split is a starting point, not a fixed rule. A warehouse with 50,000 SKUs and a heavy long tail might use 10/20/70 instead. Run the numbers on your own data before locking in the tiers.
2. Affinity Matters (Co-occurrence)
Some SKUs ship together in a large share of orders.
If two products appear on the same order 60% of the time and they sit on opposite sides of the warehouse, every combined pick adds unnecessary walk distance.
Affinity analysis builds a co-occurrence matrix: which SKUs appear together, and how often. High-affinity pairs get adjacent locations. When affinity and velocity conflict (a fast mover paired with a slow mover), the slow mover moves closer to the fast mover, not the other way around. The fast mover stays in the prime zone. The slow mover gets a nearby secondary slot.
Manual affinity analysis in Excel is only practical for small SKU counts. Above a few hundred pairs, software handles the trade-offs automatically.
3. Constraints Are Hard Rules
No slotting plan can override physical and regulatory constraints:
- Weight and ergonomics: Heavy items at waist height to reduce injury risk. Very heavy items on ground level only. (OSHA storage guidelines)
- Flammable goods: Sprinkler-equipped zones, away from ignition sources and incompatible chemicals.
- Temperature zones: Frozen in freezer areas. Climate-sensitive items (electronics, batteries) in controlled zones.
- FIFO/FEFO compliance: In food, pharma, and cosmetics warehouses, products with upcoming expiry dates need accessible pick locations so they ship first. If a newer batch sits in the prime slot while an older batch is buried in the back, you end up with expired stock and write-offs.
Manual slotting often violates constraints because there is no central check. Software enforces them automatically before any slot change is deployed.
4. Regular Slotting Audits
A slotting plan is not a set-and-forget exercise.
Demand shifts, new products arrive, and seasonal patterns change. What was optimal six months ago may now be adding unnecessary walk time. Quarterly audits are a good default: review whether your current product-to-location assignments still match actual pick velocity, and reslot where they do not.
Without periodic audits, slotting degrades silently. Pick times creep up, prime zones fill with products that are no longer fast movers, and the warehouse drifts back toward the "slotted by accident" state.
5. Build Flexibility Into Your Slotting Strategy
New product launches, unexpected demand spikes, changes in supplier lead times, or a shift from B2B to B2C fulfillment can all invalidate your current layout.
A flexible slotting strategy means your warehouse can reposition products quickly when conditions change. That requires two things: event-driven triggers for reslots (not just a calendar date, but also triggers like a 20%+ volume shift or a new product launch), and a layout that supports partial reslots without disrupting the entire operation.
Static vs Dynamic Slotting: What Is the Difference?
This is the question that separates warehouses running modern inventory slotting from those stuck in an outdated model. The terms get thrown around loosely, so clear definitions first.
Static slotting assigns each SKU to a fixed location. That assignment stays the same until someone manually decides to change it, usually during a scheduled reslot (quarterly, biannually, or before peak season). The product lives in the same bin or shelf position for months at a time, regardless of what happens to demand.
Dynamic slotting continuously monitors pick velocity and order patterns, then triggers reslot recommendations when actual demand diverges from the current layout.
A product that suddenly spikes in volume gets flagged for a move to a better location within days, not three months from now.
Recent research into dynamic storage location assignment (Technologies, 2022) confirms that automated reassignment policies consistently outperform fixed layouts in high-variability environments. Dynamic slotting requires software and a warehouse culture that accepts small, frequent changes.
When Static Slotting Still Makes Sense
Static slotting is not obsolete.
It works well when your catalog is stable, SKU turnover is low, and demand follows predictable patterns. A parts distributor with 1,500 SKUs and steady monthly volumes can run a quarterly reslot in a spreadsheet and get solid results. The cost of setting up dynamic slotting software is not justified if your velocity rankings barely change from one quarter to the next.
When Dynamic Slotting Wins
Dynamic slotting becomes essential when the ground keeps shifting under your operation.
E-commerce warehouses with seasonal demand swings, 3PLs onboarding and offboarding clients, and any operation with a growing or frequently changing SKU count all benefit from continuous reslot logic. WMS-driven re-slotting has been shown to reduce picker travel time by 45% compared to static models in these environments.
The pattern is straightforward: the more volatile your demand, the more value dynamic slotting delivers. Static slotting optimizes for a snapshot. Dynamic slotting optimizes for a moving target. If you are weighing whether your operation needs this level of flexibility, our breakdown of automation realities for 3PLs covers the practical considerations.
The Hybrid Approach
Most warehouses that move beyond basic static slotting do not jump straight to fully dynamic.
The practical middle ground is a hybrid: set a static baseline through a thorough ABC analysis, then layer in periodic dynamic adjustments as demand data accumulates. Run a full reslot quarterly. Between those quarterly resets, let software flag the top 20-30 SKUs whose velocity has shifted enough to justify a move. This gives you most of the benefit of dynamic slotting without requiring a complete cultural shift on day one.
Manual Slotting vs WMS-Driven Slotting
The static-vs-dynamic question is about timing. The manual-vs-software question is about capability. Both matter, and they are different decisions. A warehouse can run static slotting in software (quarterly reslots computed by an algorithm) or dynamic slotting manually (a warehouse manager who checks velocity reports weekly and moves products by gut feel). But in practice, dynamic slotting without software falls apart at scale.
The comparison below shows what changes when you move from spreadsheet-based wms slotting to a dedicated optimization tool.
The Compounding Effect
The 18% walk distance improvement from better slotting alone combines with the 20-55% from optimized picking routes.
These gains compound because slotting shortens the distances between picks, and route optimization finds the best sequence through those shorter distances. In practice, warehouses that apply both see total walk time reductions of 35-60% compared to unoptimized baselines.
This compounding effect is the core business case for treating slotting as infrastructure, not a one-time project. A mid-size distributor that ran ABC-integrated re-slotting reduced picker travel by 27% on average. When they added route optimization on top, total walk time dropped further. The two optimizations reinforce each other: better slot positions mean shorter route segments, and better routes mean each slot position delivers maximum value.
Slotting for Peak Season: Heatmaps and What-If Scenarios
Peak season demands a different slotting strategy. Your slow movers during normal operations might be fast movers in peak. Seasonal items need better locations for only 6-8 weeks, then revert back. The warehouse slotting optimization software market is projected to grow by USD 834.7 million at 11.7% CAGR through 2030 (Technavio, 2025), driven in large part by the need for this kind of seasonal agility.
Peak Season: What-If Scenarios
The manual approach to peak preparation: predict which SKUs will spike, reslot them early, then reslot back after peak. This is risky because predictions are often wrong, and the reslot itself eats into the limited time before peak volumes hit.
The software approach: use Pulse to simulate different slotting strategies before deploying them. Create two scenarios, one for normal season and one for peak. Run picking simulations on both with projected peak order volumes. See which scenario delivers better metrics. Deploy the peak scenario two weeks before peak starts, then switch back after.
This "pre-peak optimization" prevents the chaos that hits when pickers are suddenly handling 40% more volume with the wrong slotting. Throughput stays stable. Error rates stay low. Staffing needs do not spike as severely because the warehouse layout is already tuned for the volume.
When to Reslot: Warning Signs
You do not always need heatmap software to know your slotting is off. These are the day-to-day signals that tell you a reslot is overdue:
- Rising average pick times with no change in order volume or headcount.
- Frequent replenishment runs in prime zones, meaning fast movers are in locations that are too small.
- Pickers consistently skipping locations or deviating from assigned routes because they know a product was moved or is out of stock.
- New products placed in whatever location is empty rather than where velocity data says they should go.
- Congestion in specific aisles while other zones sit nearly empty.
If you are seeing two or more of these, your current slotting is costing you. A targeted reslot of your top 500 SKUs can address the worst problems in days, not weeks.
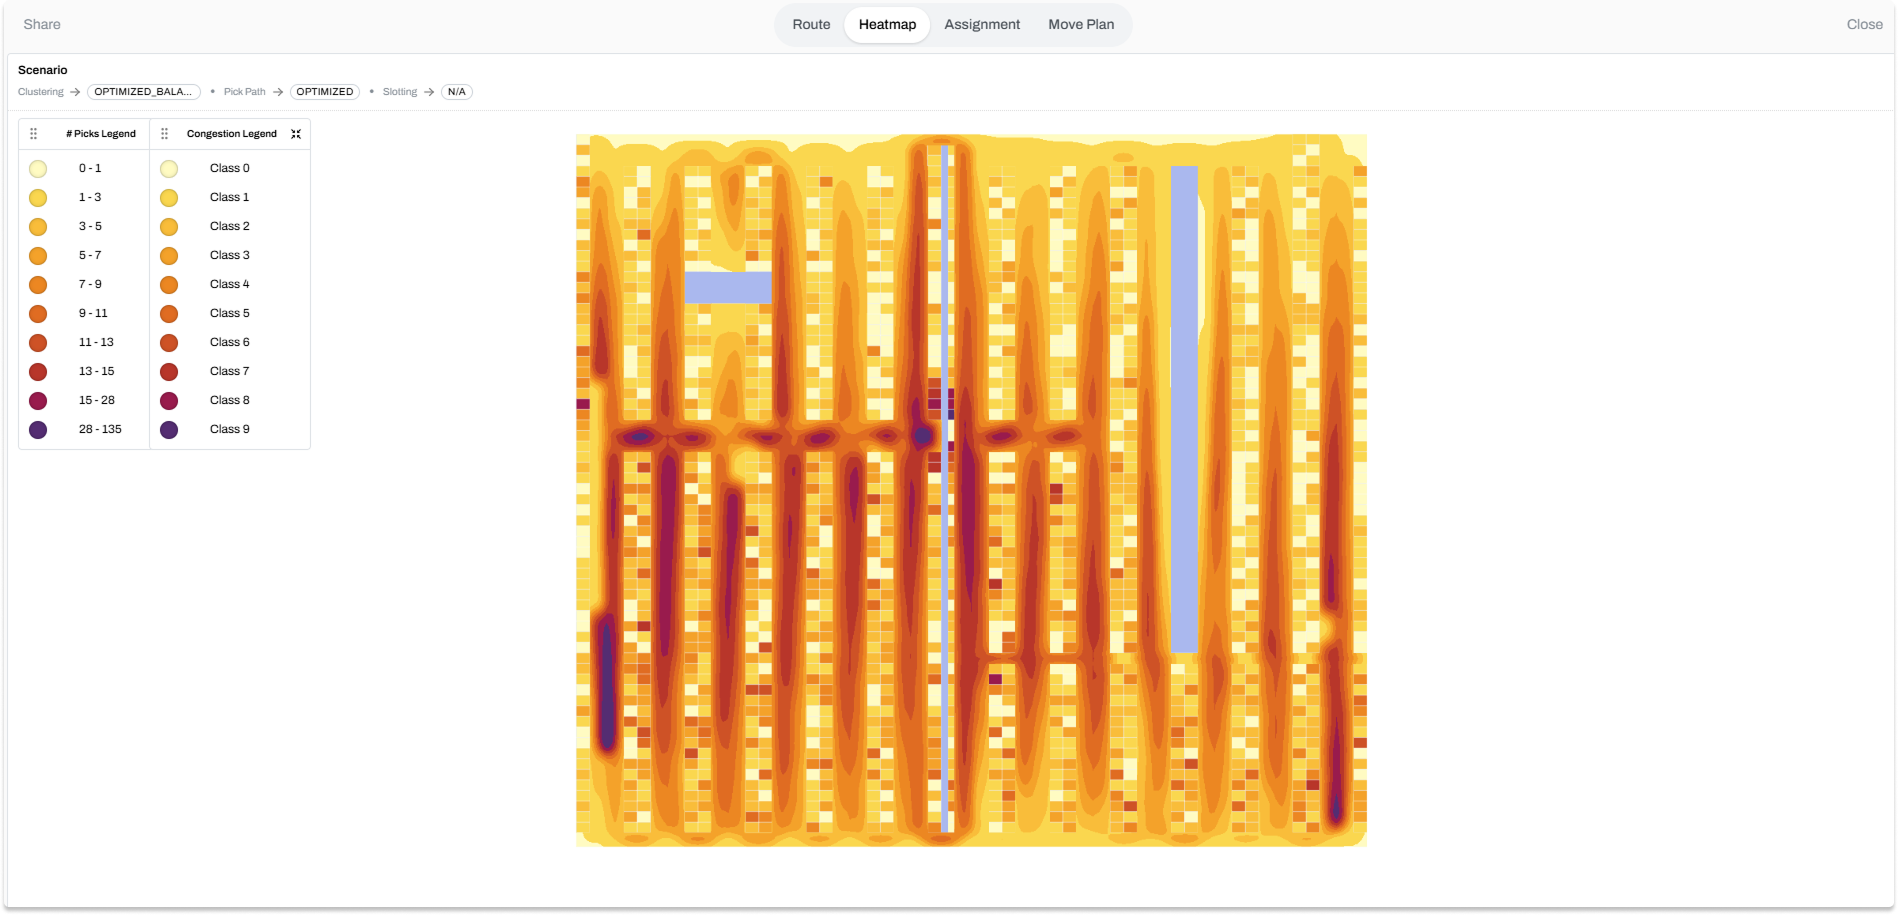
Heatmaps: Seeing Where the Work Really Is
A heatmap visualizes pick density by location. Darker colors mean more picks happen there. Lighter colors mean fewer picks. A healthy heatmap shows hot spots concentrated near the packing station with a gradual fade outward. A problem heatmap shows hot spots scattered across the warehouse, which tells you fast-moving SKUs are misslotted in remote zones.
For a deeper look at how layout visualization supports slotting decisions, see our guide to warehouse layout mapping.
Why Slotting Works Best Combined with Picking and Packing Optimization
Most articles about warehouse slotting treat it as a standalone problem. Optimize your slot assignments, reduce walk distance, move on. That approach produces results, but it leaves a significant portion of the potential gains untouched.
The Silo Trap
Optimizing slotting alone produces a local optimum. You get better product placement, shorter walks to individual picks, and improved capacity utilization. But if your picking routes are still planned independently of that slotting, and your packing sequences do not account for how items arrive at the packing station, you are solving one piece of a three-piece puzzle.
A location change ripples through every pick route and every packing decision. Move a high-velocity SKU from aisle 12 to aisle 3, and every batch that includes that SKU now has a different optimal route. The packing sequence changes too, because items arrive at the pack station in a different order, which affects pallet stability and carton fill rates.
Combined Optimization: How It Works
When slotting, picking, and packing are optimized together, the system considers all three simultaneously. A slot assignment is not just "put this SKU in the fastest-access location." It is "put this SKU where it shortens the most pick routes, arrives at the pack station in the best sequence for stable pallets, and does not violate any storage constraint."
That is a fundamentally different calculation than slotting alone. And it is why the compounding effect is so significant: the 18% walk distance improvement from slotting alone combines with the 20-55% improvement from route optimization and the packing efficiency gains from better item arrival sequences. Our deep dive on optimizing pick and pack operations explains how those three layers interact in practice.
Companies like Bleckmann, GXO, and CEVA trust Pulse to run this combined optimization across their warehouse operations. The difference between isolated slotting software and a combined pick-pack-slot platform is the difference between tuning one instrument and conducting the entire orchestra.
"There are many areas of our warehouse operations where Optioryx's solutions helped us improve efficiency." - Kevin Paindeville, Warehouse Solutions and Innovation Director, Bleckmann
For a detailed breakdown of how different slotting tools compare on this and other dimensions, see our guide to slotting optimization software.
How to Start Your Warehouse Slotting Optimization
You do not need to reslot your entire warehouse to see results. A controlled pilot on your top 500 SKUs can prove the business case in under two weeks. If you want a step-by-step walkthrough of the physical reslot process, see our guide on how to reslot your warehouse without shutting down.
What Data Do You Need?
Before anything else, pull your pick history from the WMS. You need at least 12 weeks of data with these fields per pick line: SKU ID, pick location, timestamp, and quantity. If you have order IDs, even better, because that lets you run affinity analysis. Most WMS platforms can export this as a flat file or CSV. Without this data, you are guessing.
The Pilot Steps
- Baseline and analysis. Pull 12 weeks of pick data. Rank SKUs by velocity. Identify your top 500 A items and 1,000 B items. Map your warehouse zones and quality-score each location (proximity to packing, pick height, aisle traffic).
- Simulation. Feed your data into slotting software (or build an Excel model for smaller operations). Assign A items to prime locations, B items to secondary. Compare the simulated walk distance against your current state. Target: 15-25% reduction.
- Physical reslot. Move products from their current locations to new assigned locations. This takes 2-4 people for about 2 weeks in a mid-size warehouse. Do it during a low-volume period if possible.
- Measurement. Track metrics for one full week post-reslot: average walk distance per wave, picks per hour, accuracy rate, capacity utilization. Compare against baseline.
- Decision point. If you see a 15%+ reduction in walk distance and no increase in errors, the business case is clear. Roll out to the full operation or refine and test again.
Worried About Downtime?
You do not have to reslot everything at once. A phased approach works: start with one zone or one aisle, reslot during a low-volume shift (evenings or weekends), and validate the results before moving to the next zone. Most warehouses can reslot their top 500 SKUs across 2-3 zones in under a week this way, without disrupting daily operations.
When Does Manual Stop Being Enough?
If you have fewer than 5,000 SKUs and fairly stable demand, manual ABC slotting in Excel works. It takes effort, but it is manageable. Above 5,000 SKUs, or with seasonal demand swings, product launches, or multi-warehouse operations, the number of variables exceeds what a spreadsheet can handle. That is when slotting software pays for itself: not because the logic is different, but because the scale of the problem outgrows manual tools.
Questions?
ABC slotting assigns product storage locations based on pick velocity. A items (the fastest movers — typically the top 20% of SKUs) get premium locations near the packing station. B items (the next 30% by velocity) get secondary locations. C items (slow movers, the bottom 50%) are assigned to remote zones. The result is that pickers spend most of their time picking high-velocity items that are now physically closest to them, reducing average walk distance by 15–30% without any change to picking method or routing.
A warehouse heatmap is a visual representation of pick density by storage location. Darker colors (red or orange) indicate high-pick zones; lighter colors (yellow, green, or gray) indicate low-pick zones. Heatmaps reveal whether slotting is working — a healthy heatmap shows hot spots concentrated near the packing station with a gradual fade outward. A problem heatmap shows hot spots scattered across the warehouse, indicating that fast-moving SKUs are misslotted in remote zones. Heatmaps can be generated from pick data in slotting software (updated weekly or monthly) or manually in Excel (typically quarterly).
Most warehouses reslot twice per year: once before peak season (to promote seasonal fast-movers to prime locations) and once after peak (to normalize back to standard velocity patterns). Fast-moving or high-SKU-count operations may benefit from quarterly reslotting. A practical trigger rule: when your velocity distribution has shifted by more than 20% — meaning the same top-20% of SKUs now account for a meaningfully different share of total picks than they did at your last reslot — it is time to re-evaluate your slot assignments.
Slotting is the structural foundation for picking productivity. Poor slotting means pickers visit more locations and walk longer distances per order, regardless of the routing policy or batching strategy applied on top. Research and operational data consistently show that 30–40% of pick walk time is attributable to poorly slotted SKUs. Good slotting cuts that waste by 40–60%, freeing pickers to spend more time on actual picks rather than travel. When combined with route optimization, slotting improvements are compounded: fixing slotting first shortens the distances that route optimization then sequences, producing total walk-time reductions of 35–60% in many warehouse environments.
Compliance in warehouse slotting means enforcing storage rules as hard constraints that cannot be overridden when assigning products to locations. These include: weight and ergonomics rules (heavy items at waist height, very heavy items on ground level only), hazardous materials rules (flammables in sprinkler-equipped zones away from incompatible chemicals), temperature zone rules (frozen, chilled, and ambient items in their designated areas), and product incompatibility rules (fragile items not above heavy items, odorous items away from food products). Slotting software enforces these automatically before any slot assignment is deployed. Manual slotting requires a separate compliance audit after each reslot, which adds 1–2 weeks of verification time and leaves room for human error.
Five mistakes account for most failed reslots: (1) reslotting without a velocity heatmap, so moves are based on guesswork rather than actual pick frequency; (2) not updating WMS locations immediately after each move, causing pickers to search the wrong aisles; (3) ignoring compliance constraints like flammability, temperature sensitivity, or allergen separation, which creates safety and regulatory gaps; (4) poor team communication, which drops morale and increases errors when pickers don’t understand why locations are changing; and (5) running out of temporary staging space, which causes phase backups and slows operations anyway. Planning for all five before Day 1 eliminates most reslotting problems.
Most slotting software implementations require order history (6-12 months minimum), SKU dimensions and weight, bin capacity data, and current pick counts by location. The more complete your order history, the better the velocity and affinity analysis the tool can run. Most vendors will help you collect and format this data during onboarding - if a vendor can't explain exactly what data they need upfront, that's a red flag for implementation readiness.