


Summary
4 ways to improve your slotting
How do you move from outdated, static item placements to continuous slotting that handles the scale you operate at, and turns those decisions into something your team can act on?
A full re-slot is the version most people picture, and it needs a window most warehouses rarely get. It is also only one of four ways to improve a slot plan. The other three run inside normal operations, which is why they are the ones to reach for first. So the question is narrower: which actions are realistic to execute, and which of them improve space utilization, compliance and picks per hour?
1. Re-slotting
Rank every possible move by how much walking it saves, then take only the top ten or the top fifty. One operator walks that list at the end of a shift. Next week it rebuilds against fresh order data.
The cap is the entire idea. A ranked list of ten moves is a job. A re-slot is a project, and projects wait for a quarter that never comes.
2. Full re-slot
Every SKU gets its best location assigned from scratch. Nothing is held fixed, so this is the action with the most scope to change, and the one that needs a shutdown window or a quiet week to execute.
It also decays. A plan built from one quarter's order profile starts drifting as soon as that profile moves, so a full re-slot only keeps its value when it is paired with ongoing re-slotting. Run once and left alone, it starts losing ground the day it goes live.
3. In replenishment
Every inbound item is a slotting decision. In most warehouses it goes to whatever location is closest or free, decided by whoever is holding the scanner.
Deciding it on data costs nothing extra. The labor to move the item is already being spent, so it is only a question of whether the location it lands in was chosen or accepted.
4. SKU housekeeping
Here the locations need attention, not the items sitting in them. A slow mover ends up spread across three pallet positions, each holding a few cartons. Merge it into one and you get two positions back.
A fast mover in one lane runs dry twice a shift. Split it across two lanes and it runs dry once. Merging buys space, splitting buys time.
All four need the same thing underneath, and that is where most warehouses stop.
How most warehouses do it today
Most warehouse slotting today falls into one of a handful of patterns. Some things worth checking against your own operation:
- Slotting was done once, and not since. The plan fits the order profile of the year it was built, and that profile has moved since.
- Fixed slotting. Every SKU keeps one permanent home. The location stays reserved even when the item stops selling, so the plan cannot follow demand.
- It is ABC and nothing else. Ranking SKUs by pick frequency and giving the fastest movers the best locations captures the biggest driver of travel. It says nothing about cube, weight, expiry or what gets ordered together, and it crowds the aisles it just made popular.
- Slotting lives in an Excel sheet. One person owns it and rebuilds it by hand, which is why it gets rebuilt about once a year.
- The WMS assigns locations without knowing the real warehouse layout. It sees a legal empty bin of the right size, not how far someone walks to reach it.
- New SKUs get whatever location happens to be free. The decision lands on whoever is holding the scanner at receiving.
- Nothing changes before or after peak season. The weighting that works in a normal week is the wrong one at three times the volume, which is the single most common version of this list. We went through it in the 6 slotting mistakes warehouses make before peak.
- Nothing accounts for how often items are bought or ordered together. Items that ship in the same order sit in different aisles, so one order walks the building.
What insights your data is hiding
Warehouse heatmap analysis
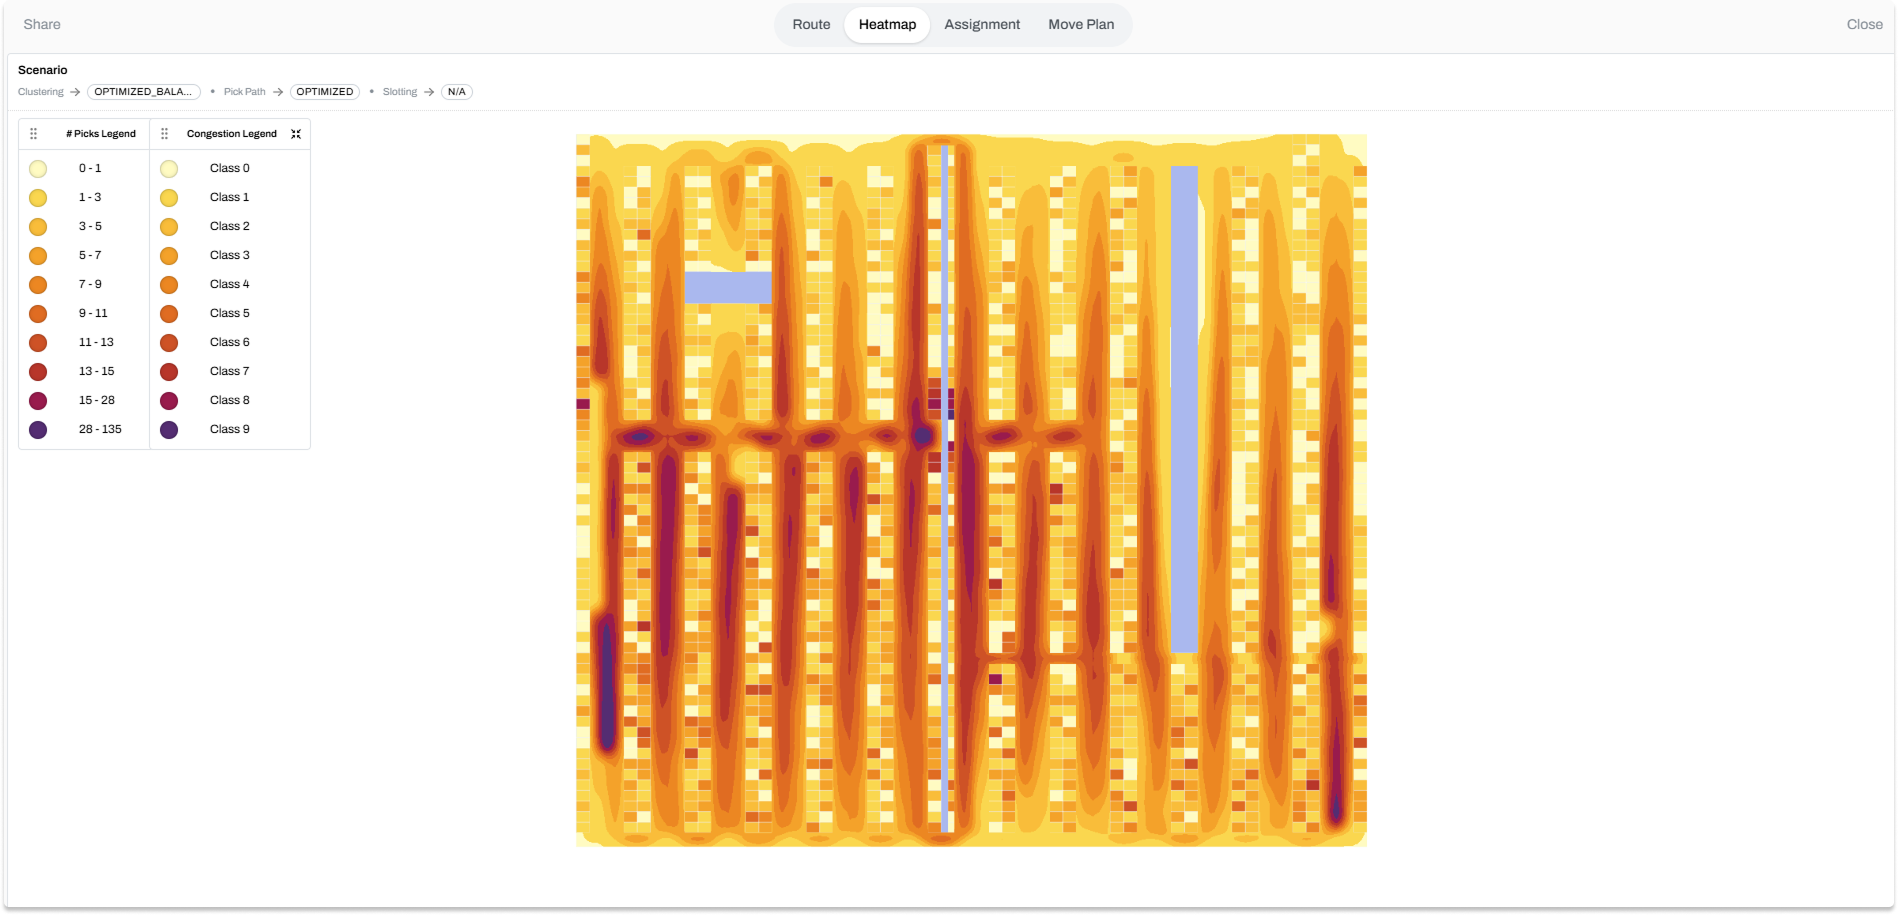
A heatmap colors every location by how often it is picked. Dark means high pick density, light means low. A healthy pattern concentrates near dispatch and fades outward.
Three patterns say something is wrong. Dark cells in far zones mean fast movers are sitting where they cost the most to reach. Light cells in prime locations mean golden-zone space is being spent on items that do not earn it. Dark cells stacked in one aisle mean velocity was optimized without congestion, so the walk got shorter and the pickers now queue behind each other.
That third pattern is the one that surprises people, because on paper the plan looks right.
Impact of re-slots to your pick-per-hour rate
Every possible move gets scored, then ranked by what it saves. You choose how many you are willing to make, and the list stops there.
Our own modelling puts a ten-move list at roughly 3 to 4% more picks per hour, because the moves are chosen by impact, not by whatever caught someone's eye.
End of shift re-slot moves
The ten-move figure and the curve are the same thing seen at two points. Twenty moves is worth around 5%, sixty around 10.5%, and the line flattens as it goes. The first handful of moves does most of the work, which is why capping the list costs you very little.
Slotting trade-offs
Every slotting objective has a cost, and the cost usually lands on another objective. Push velocity to its limit and you concentrate pickers into the same aisles. Group by product family for pick accuracy and you put look-alike items side by side, which is where mispicks come from.
There is no assignment that wins on every objective. What an analysis can show you is where your current plan sits, and which trade you are making without having chosen it. Pick one objective below and watch the other seven move.
Test data, for illustration.
The weights change in peak
The radar shows one fixed set of weights. Those weights do not hold all year. Once volumes climb and more pickers work the same aisles, waiting starts costing more than walking, so congestion and replenishment effort move up the list and walk distance moves down it.
| Objective | Normal weeks | Peak |
|---|---|---|
| Picking walk distance | High | Medium |
| Congestion | Low | High |
| Replenishment effort | Medium | High |
| Stackability and pack quality | Unchanged | Unchanged |
| Compliance and physical constraints | Highest | Highest |
View this comparison on desktop for the full data table.
The method is the same in both columns. Only the weighting moves, and it has to move before the season starts, because a slot plan is physical and moving stock takes shifts. Bart works through which objectives to re-weight and in what order in how to slot a warehouse during peak season.
Simulate the gain
The analysis runs in a warehouse digital twin of your building: your layout, your locations, your order history.
You get the move list and the projected change in picks per hour before anything moves. Pulse runs that scoring on top of your existing WMS and hands back the ranked list. Your WMS keeps the system of record, and nothing gets replaced. If you are weighing tools, we compare the options in our slotting software guide.
Questions?
A slotting analysis reads your pick history, item master, location data and current assignments, then ranks which SKU-to-location changes are worth making. The output is a list of moves ordered by impact, not a new warehouse layout.
Five files: your warehouse layout, location data with sizes and capacities, SKU master with weight and cube, order history, and your current SKU-to-location assignment. Around a year of history covers seasonality.
The more you want to optimize for, the more your WMS has to give us. Travel distance needs layout and orders. Add expiry, temperature zones or crush rules and each one needs its own field. We check what you have before anything runs.
ABC is a good first pass and a poor final answer. It ranks SKUs by pick frequency and assumes every location can hold anything, which stops being true once temperature zones, weight limits, crush rules and expiry come into it. Published research on the cube-per-order index, the classic slotting heuristic, found its worst case can be arbitrarily far from optimal because it ignores how items interact.
A warehouse heatmap is a visual representation of pick density by storage location. Darker colors (red or orange) indicate high-pick zones; lighter colors (yellow, green, or gray) indicate low-pick zones. Heatmaps reveal whether slotting is working — a healthy heatmap shows hot spots concentrated near the packing station with a gradual fade outward. A problem heatmap shows hot spots scattered across the warehouse, indicating that fast-moving SKUs are misslotted in remote zones. Heatmaps can be generated from pick data in slotting software (updated weekly or monthly) or manually in Excel (typically quarterly).
Up to a point. A spreadsheet holds up below roughly 500 SKUs with steady turnover. Past that it stops being arithmetic: 5,000 SKUs against 7,000 locations gives a number of possible pairings with more than 16,000 digits.
Excel also caps you at one or two objectives, gives you no way to test a scenario before you commit, and leaves you without a ranked move list at the end.
Fewer than most people expect. Optioryx modelling puts a ten-move end-of-shift list at roughly 3 to 4% more picks per hour, because the moves are ranked by impact rather than picked at random.
The point of a capped list is that one operator can finish it inside a normal shift, then the list rebuilds against fresh order data.
Most WMS modules assign locations. They do not optimize them against competing constraints, they often cannot handle a SKU that floats between locations, and they rarely model your real layout or travel distances. Pulse runs on top of your WMS and writes the result back, so you keep the system of record.